February 27, 2026
Somewhere in your dealer network right now, a warranty claim is being processed that shouldn’t be. It might be a repair that never happened. A part that was replaced but returned to inventory. A labor time flagged at 4.2 hours when the job takes 1.8. Or a VIN that’s appeared in three different service centers within a 60-day window.
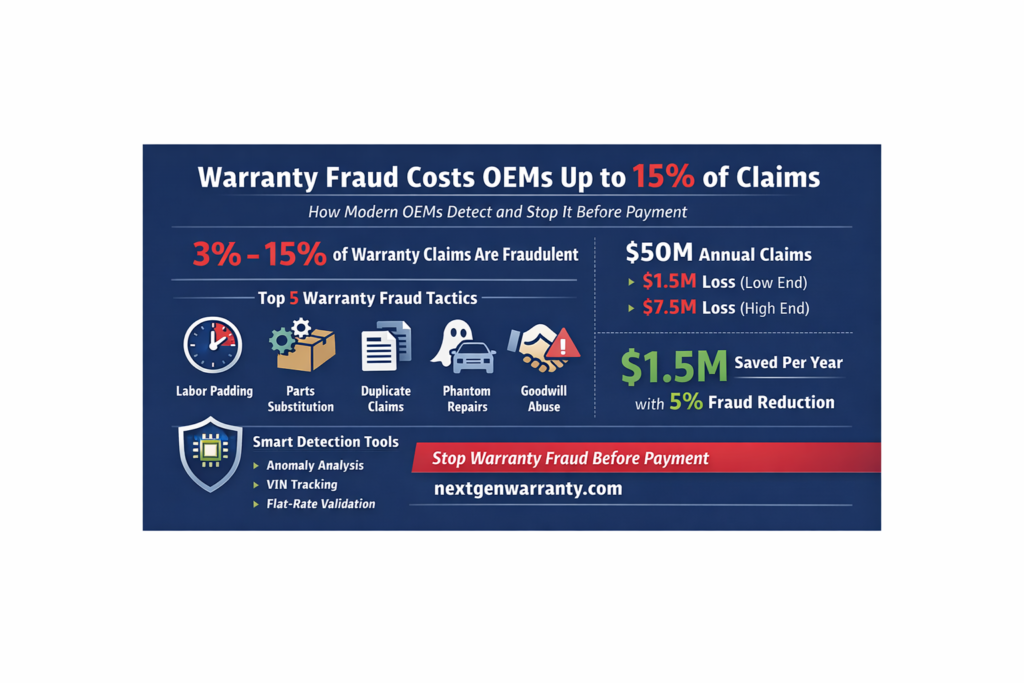
These aren’t edge cases. Industry analysis consistently places fraudulent or inaccurate warranty claims at 3% to 15% of total claims value for automotive and industrial OEMs — and the variance between those numbers largely reflects how sophisticated your detection is, not how honest your dealer network is.
For a manufacturer processing $50 million in annual warranty claims, the low end of that range is a $1.5 million leak. The high end is $7.5 million — vanishing without a single audit flag.
What makes warranty fraud so operationally dangerous isn’t just the dollar amount. It’s the invisibility. Unlike fraud in financial systems, where anomalies create obvious paper trails, warranty fraud exploits the asymmetry of information between OEMs and their dealer networks. The OEM wasn’t there when the repair happened. The OEM can’t easily verify what parts were used, how long the job actually took, or whether the vehicle was even on-premises.
This article breaks down how OEM warranty fraud actually happens, what your current detection gaps probably are, and what it takes to stop it — at scale, across a global dealer network.
Before you can detect fraud, you need to understand the patterns. Warranty fraud isn’t usually a rogue dealer running an obvious scheme — it’s systematic, incremental, and often hiding in plain sight within your existing claims data.
1. Time inflation (labor padding)
A dealer submits a claim for 4 hours of labor on a repair the OEM’s own flat-rate manual prices at 2.5 hours. Multiplied across thousands of claims, this is one of the highest-volume warranty cost inflators. It’s hard to catch without automated benchmarking against your own rate guidelines.
2. Parts substitution
A failed component is replaced under warranty using a lower-cost aftermarket part, but the claim is submitted at OEM genuine-parts pricing. The margin goes to the dealer. In some cases, the genuine OEM part is never installed, or is returned to dealer inventory for resale.
3. Duplicate claims
The same repair event is submitted multiple times — under different claim IDs, slightly altered dates, or via different service advisors at the same location. Without cross-referencing at the VIN and symptom level, these pass through undetected.
4. Phantom repairs
A claim is submitted for a repair that either never occurred or was performed on a vehicle that was never brought in for service. Telematics data increasingly exposes these cases, as vehicle location records contradict claimed service dates.
5. Goodwill abuse
Dealers submit goodwill or policy adjustment claims for vehicles outside the warranty period, or inflate the scope of goodwill repairs. Without structured authorization workflows, these bypass standard claim validation entirely.
Most warranty management systems were designed to process claims efficiently — not to investigate them. That trade-off no longer makes financial sense. Here’s where the typical gaps are:
Modern warranty fraud detection has shifted from a reactive audit function to a proactive, data-driven capability embedded in the claims workflow. The difference in outcomes is substantial.
Rather than flagging claims against fixed rules, statistical models establish a baseline of expected behavior for each claim type, repair code, dealer, and vehicle model. Claims that deviate significantly from that baseline — in labor time, parts usage, claim frequency, or repair code combination — are automatically elevated for review before approval.
This approach catches patterns that no human analyst could identify manually. A dealer whose average labor time for a specific repair code is 22% higher than the regional mean, consistently, over 18 months, surfaces as a risk before a single dollar of fraud is proven.
Every claim submitted against a VIN should be evaluated in the context of that vehicle’s full claims history. A transmission claim submitted three months after a nearly identical transmission claim at a different dealer is a fraud signal — or at minimum, a quality signal that warrants investigation. Cross-referencing at the VIN level is one of the most effective fraud-reduction tactics available, and one of the most underused in dealer network warranty operations.
Your warranty system should automatically compare submitted labor time against your approved flat-rate manual for every claim, for every repair code. Any claim exceeding your stated flat-rate guideline by more than an acceptable tolerance should require additional documentation before processing. This single capability alone typically reduces labor-related leakage by 8–12% in the first year of implementation.
For OEMs with connected vehicle capabilities, telematics data provides a factual record that can validate or contradict dealer claims. If a vehicle’s location data shows it was 200 miles from the dealership on the date the repair was allegedly performed, that’s an audit trigger. EV OEMs have a particular advantage here, as battery and software telemetry creates a detailed operational history that’s difficult to falsify.
Any warranty claim involving parts replacement should be tied to a parts return requirement — and that return should be tracked, verified, and reconciled against the claim before final payment. High-risk parts warrant additional documentation, including condition photos and part number verification. Closing the loop between claims payment and parts return eliminates one of the most common fraud vectors.
Technology addresses the detection gap. Sustainable warranty fraud reduction requires a broader program.
The math on warranty fraud detection is unusually clear for a technology investment. If your OEM processes $30 million in annual warranty claims and a fraud detection system reduces fraudulent or inaccurate claims by just 5% — a conservative outcome — that’s $1.5 million in annual recovery. For most warranty software investments, the payback period measured against fraud reduction alone is under 12 months.
That figure doesn’t include the downstream benefits: improved supplier recovery rates when parts fraud is caught earlier, reduced reserve requirements when claim accuracy improves, and better product quality signal when fraudulent repair codes stop polluting your failure data.
The US market is adding urgency to this investment. New York’s retail labor rate law, enacted in September 2024, requires OEMs to reimburse warranty labor at retail guide rates — increasing per-claim reimbursement and raising the financial stakes of every fraudulent or inflated labor claim in the network. As reimbursement rates rise, so does the incentive to inflate.
OEMs that invest in systematic fraud detection now are not just protecting existing margin. They’re building the data infrastructure that will define their warranty operations for the next decade — as EV complexity, OTA liability, and right-to-repair compliance requirements make warranty data governance more critical than it has ever been.
| Key Takeaways 3–15% of total claims value is lost annually to warranty fraud and claim inaccuracy — most undetected under rule-based systemsThe five highest-impact fraud patterns: labor padding, parts substitution, duplicate claims, phantom repairs, and goodwill abuseEffective detection requires statistical anomaly modeling, VIN-level correlation, flat-rate validation, telematics integration, and parts return verificationA 5% fraud reduction on $30M in annual claims = $1.5M in direct annual recovery — typically within 12 months of implementationRising reimbursement rates, EV complexity, and right-to-repair compliance are increasing the financial stakes of every inaccurate claim in your network |
Structured for FAQPage schema. Apply markup at schema.org/FAQPage to maximize AI Overview and featured snippet capture.
| Q: What percentage of OEM warranty claims are fraudulent? Industry analysis places fraudulent or inaccurate warranty claims at 3% to 15% of total claims value for automotive and industrial OEMs. The variance in that range reflects detection sophistication, not dealer network integrity. OEMs with rule-based or manual audit processes tend to sit closer to the 10–15% range; those with automated anomaly detection and VIN-level correlation typically reduce verified fraud to under 5% of claims value. |
| Q: What technology do large OEMs use to detect and prevent warranty claim fraud from dealers? Leading OEMs use a combination of statistical anomaly detection engines, VIN-level claim history correlation, automated flat-rate validation against approved labor time manuals, telematics data integration for repair verification, and parts return tracking tied to claim payment. Modern warranty management systems embed these checks into the pre-approval workflow — flagging high-risk claims before payment, not after. This is fundamentally different from legacy rule-based systems, which only flag claims that exceed hard-coded thresholds. |
| Q: How does machine learning improve warranty fraud detection compared to traditional rule-based systems? Rule-based systems flag what you explicitly program them to flag — and sophisticated dealers learn to game static thresholds quickly. Machine learning models instead establish dynamic baselines of expected behavior for each claim type, repair code, dealer, and vehicle model, then score deviations in real time. This allows the system to detect subtle patterns — like a dealer whose labor times are consistently 18% above the regional mean for a specific repair code — that no static rule would ever surface. ML-based systems also improve over time as they process more claims data, unlike rules which require manual updates. |
| Q: What are the most common ways dealerships submit fraudulent warranty claims? The five most documented fraud patterns in OEM dealer networks are: (1) labor time inflation, where submitted hours exceed the flat-rate manual guideline; (2) parts substitution, where aftermarket parts are installed but claimed at OEM pricing; (3) duplicate claim submission, where the same repair event is filed multiple times under different identifiers; (4) phantom repairs, where claims are submitted for work that was never performed; and (5) goodwill or policy claim abuse, where out-of-warranty repairs are submitted as exceptions through unstructured approval channels. Of these, labor inflation is the highest-volume issue by transaction count; phantom repairs carry the highest per-claim dollar value. |
| Q: How do OEMs recover money from fraudulent warranty claims that have already been paid? Recovery from already-paid fraudulent claims typically follows a three-step process: audit identification, formal dispute filing, and dealer chargeback or payment offset against future claims. OEMs with structured warranty audit programs recover fraudulent payments by cross-referencing paid claims against telematics data, parts return records, and flat-rate documentation after the fact. Recovery rates vary significantly — OEMs with dedicated audit teams and automated case management typically recover 60–80% of identified fraudulent claim value, while those relying on manual dispute processes recover less than 40%. The most effective fraud programs prevent payment in the first place through pre-approval screening, which eliminates the recovery cost entirely. |
| Q: Do warranty fraud patterns differ between automotive OEMs and agricultural or construction equipment OEMs? Yes, significantly. Automotive OEMs face higher volumes of labor padding and duplicate claims due to the sheer transaction scale of passenger vehicle dealer networks. Agricultural equipment OEMs see pronounced seasonal fraud spikes during and after harvest season, when dealers process high claim volumes under time pressure and audit scrutiny is lower. Construction equipment OEMs face a higher incidence of phantom repair claims, driven by the remote, field-based nature of equipment operation — a machine breaking down 200 miles from a dealer creates documentation gaps that bad actors exploit. Each vertical requires calibrated fraud detection baselines, not a one-size-fits-all rule set. |
| Ready to stop warranty fraud before claims are approved — not after? See exactly how Next Gen Warranty’s claims intelligence engine flags high-risk submissions, benchmarks labor times against your flat-rate manual, and surfaces VIN-level anomalies in real time. Book a Demo |
Book a 30-minute walkthrough tailored to your industry.
Schedule a Demo