June 10, 2026
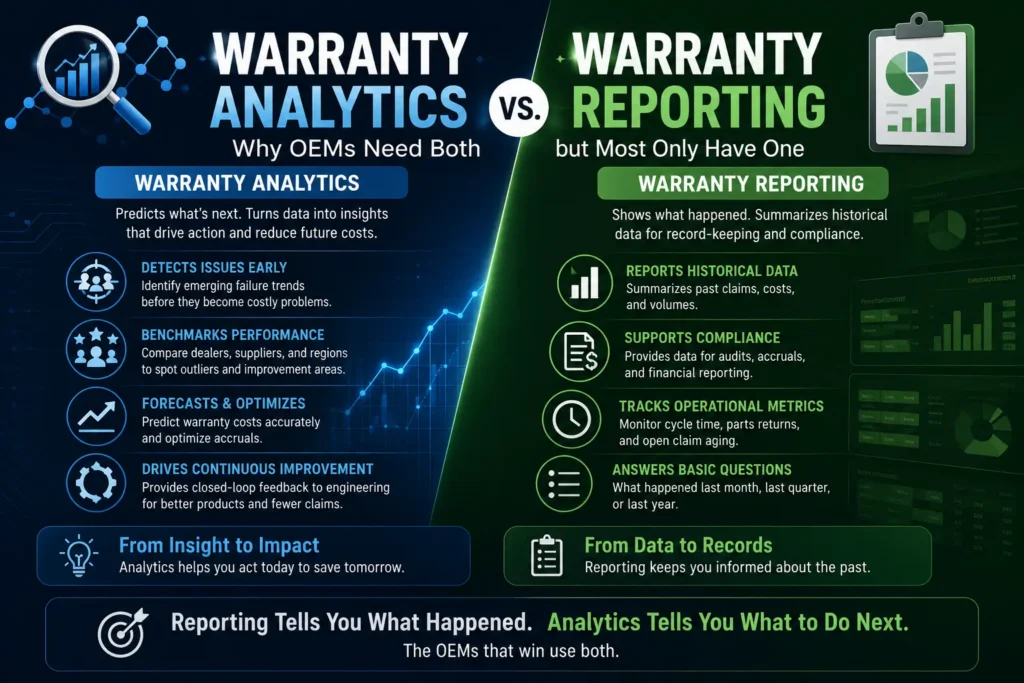
Most OEM warranty teams can tell you how many claims they processed last month. They can tell you the total claim cost, the average cost per claim, and which dealers submitted the most volume. These are reporting outputs. They describe what happened.
What most OEM warranty teams cannot tell you is which component failures are increasing in frequency six months before they generate high cost, which dealers have claim approval rates that are statistically inconsistent with their peers, or which model year variants are trending toward warranty cost overruns before the accrual period closes. These are analytics outputs. They describe what is happening and what is likely to happen next.
The difference between reporting and warranty analytics for OEMs is not cosmetic. It is the difference between a team that closes the books on each claim and a team that uses warranty data to reduce future claims, improve products, and protect margins.
Standard warranty reporting answers operational questions about completed events. Common reporting outputs include:
These outputs are necessary. Finance teams need them for accrual calculations. Operations teams need them for dealer audits. But they are backward-looking by design. A reporting system tells you what the warranty program cost last quarter. It does not tell you why, and it does not tell you what to expect next quarter.
Analytics applies statistical methods to warranty claim data to identify patterns that reporting alone would not surface. A specific fastener on a specific model year failing at a rate that is 2.4 times higher than the fleet average is not obvious in a claims volume report. It appears when claim data is broken down by part number, analyzed by production batch, and compared against expected failure rates for that component category.
Detecting that signal early changes the financial outcome significantly. According to McKinsey’s research on automotive quality operations, OEMs that can identify emerging failure patterns within 90 days of field exposure spend 30 to 40 percent less on the resulting warranty costs compared to those that identify the same problem after 12 to 18 months of claim accumulation. Early detection enables targeted field action or supplier recovery before the full claim population materializes.
Not all warranty costs are product costs. A meaningful portion of warranty spend at most OEMs comes from dealer-side issues: incorrect repair procedures, parts ordered unnecessarily, claims filed for non-covered conditions, or submission errors that inflate totals. Identifying which dealers are outliers requires comparing claim patterns across the network.
Analytics benchmarks each dealer’s claim approval rate, average cost per repair order, parts return compliance, and repeat repair rate against peer dealers with similar volume and market conditions. Dealers that fall outside expected ranges trigger review workflows. This is not possible with standard reporting, which shows each dealer’s numbers in isolation without the context needed to evaluate whether they are normal or anomalous.
The J.D. Power 2023 Dealer Satisfaction with Warranty Parts and Procedures Study found that dealers consistently cite claim transparency and performance feedback as the areas where OEMs perform worst. Structured benchmarking through analytics addresses this directly and improves the OEM-dealer relationship alongside warranty cost management.
Warranty accruals are financial estimates of the cost to fulfill warranty obligations on units sold. Most OEMs set accruals based on historical claim rates applied to current sales volume. This works well when the product mix and failure patterns are stable. It fails when a new model or component enters the fleet with a failure profile that differs from the historical baseline.
Analytics-driven accrual forecasting monitors early-life claim rates for new launches and adjusts accrual recommendations in real time based on field data. This prevents both under-accrual, which creates surprise charges to the P&L when claims materialize, and over-accrual, which ties up reserves that could be deployed elsewhere.
The most strategically valuable output of warranty analytics is the feedback it provides to the engineering and product teams responsible for the next generation of components and vehicles. When warranty data is analyzed and summarized in a format that engineering teams can act on, failure mode frequency by component, failure rate trends by model year, and comparison of supplier part performance, it becomes a product improvement input rather than a historical record.
According to a 2022 analysis by the Warranty Chain Management Conference, OEMs with structured closed-loop warranty feedback processes report product quality improvements that reduce warranty costs by 15 to 25 percent over a three-to-five year period. The warranty data that most OEMs treat as a cost record is actually one of the highest-quality sources of real-world product performance information available to the engineering organization.
The gap between reporting and analytics is usually a systems problem, not an intent problem. Most warranty teams want the insights that analytics provides. The obstacle is that their warranty management system was designed to process and track claims, not to analyze the patterns within them.
Claims data, parts data, supplier data, and vehicle production data often sit in separate systems with no structured connection between them. Running analytics across siloed data sources requires manual extraction, spreadsheet consolidation, and significant analyst time, a process that cannot run at the frequency or volume needed to surface early warning signals.
The result is that analytics, when it happens at all, is a periodic exercise done by a small team rather than a continuous operational capability available to everyone who needs it.
NextGen Warranty’s platform is built around the principle that claims processing and warranty analytics for OEMs are not separate functions. They run on the same data, in the same system, continuously.
As claims are processed, the platform automatically aggregates failure data by component, supplier, model, dealer, and production period. Analytics dashboards make failure rate trends, dealer performance benchmarks, and cost forecasts available to warranty, engineering, and finance teams without any manual data extraction. Early warning alerts surface when claim rates for a specific part or model variant exceed defined thresholds, giving teams time to investigate and act before the claim population grows.
The closed-loop feedback module routes structured failure pattern summaries to engineering teams on a defined cadence, ensuring that field data reaches product development in a format that is actionable rather than raw. Supplier recovery claims are automatically generated from root cause data identified through the analytics layer, connecting product quality intelligence directly to cost recovery.
For OEMs managing warranty across multiple product lines, dealer networks, and geographies, this level of integration between reporting and analytics is what separates teams that manage warranty cost from teams that reduce it. See how the platform works on the NextGen Warranty analytics page.
A useful way to assess whether your organization has reporting or analytics is to ask three questions. First, can you identify your top five emerging component failure risks right now, before they become your top five claim cost drivers? Second, can you rank your dealer network by warranty cost risk, not just by claim volume? Third, does your engineering team receive a structured feed of field failure data from warranty, or do they find out about systemic issues through dealer escalations?
If the answer to any of those questions is no, the gap between your current reporting capability and what warranty data analytics software can deliver is worth closing.
Book a Demo to see how NextGen Warranty transforms warranty reporting into real-time analytics.
Warranty reporting focuses on historical data such as claim volume, cost, and processing time. Warranty analytics goes deeper by identifying patterns, predicting failures, and providing actionable insights to reduce future warranty costs.
OEMs need warranty analytics to detect emerging failure trends, benchmark dealer performance, improve product quality, and forecast warranty accruals more accurately. It helps shift warranty management from reactive to proactive decision-making.
Warranty reporting usually includes metrics like total claims, average cost per claim, claim aging, dealer-wise claim distribution, and overall warranty spend. It is primarily used for financial tracking and operational visibility.
Warranty analytics helps OEMs identify high-risk components, detect abnormal failure rates early, and reduce unnecessary claim costs. It also enables better supplier accountability and engineering feedback loops.
Warranty data analytics software is used to consolidate claims, parts, suppliers, and vehicle data into a single system. It enables OEMs to analyze failure patterns, generate insights, and automate alerts for emerging warranty risks.
Book a 30-minute walkthrough tailored to your industry.
Schedule a Demo